 |
 |
| Related Items |
||||||||||||||||||||||||||||||||||||||||||||||||||||||||||||||||||||||||
2000
Trent University
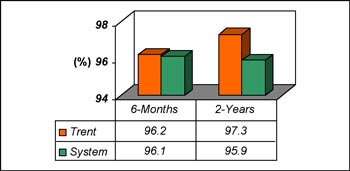
Source: MTCU How does Trent University compare against other Universities? Figure 1 compares Trent against other Ontario Universities. In 2000, Trent outperformed the system in both categories, and employment rates two years after graduation exceeded the system average by approximately 1.5 percentage points. Figure 1 - Trent University Employment Rates versus University System
Source: MTCU
| ||||||||||||||||||||||||||||||||||||||||||||||||||||||||||||||||||||||||
Return to Trent
University Home |
||||||||||||||||||||||||||||||||||||||||||||||||||||||||||||||||||||||||